2026 Top Pump Manufacturers for Global Buyers?

Choosing among Pump Manufacturers in 2026 requires more than comparing prices or browsing polished websites. Global buyers need dependable performance, documented quality, and practical support after delivery. A pump may look suitable on paper, yet fail when water contains sand, temperatures rise, or electrical conditions vary.

This guide examines leading pump manufacturers through an evidence-based purchasing lens. It considers product experience, engineering capability, production consistency, certifications, export records, and customer service. Key technical details include flow rate, total head, efficiency, material selection, seal design, and control compatibility. These factors become very real during installation, when a small specification mistake can delay an entire project.

The evaluation also considers factory audits, testing procedures, spare-parts availability, and response times. A reliable supplier should explain limitations clearly, not hide them behind broad claims. No ranking can capture every local advantage. Some evidence may remain incomplete, and buyers should verify current certificates, references, and delivery terms directly. That is part of responsible sourcing. The strongest choice may not be the largest company; it may be the manufacturer that understands a buyer’s operating conditions and communicates honestly. This overview offers a practical starting point for comparing global suppliers, while leaving room for careful technical review before any final purchase.
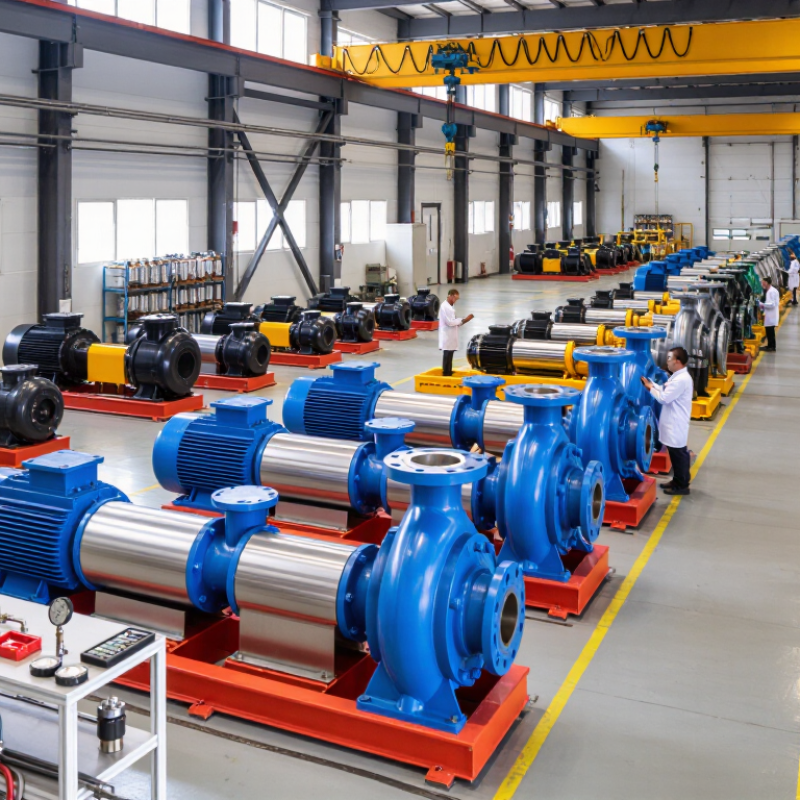
2026 Top Pump Manufacturers for Global Buyers?

Global Pump Market Outlook: 2026 Demand, Growth Rates, and Key Segments

2026 Top Pump Manufacturers for Global Buyers?

Global Pump Market Outlook: 2026 Demand, Growth Rates, and Key Segments

Global pump demand is expected to rise steadily through 2026, with most forecasts indicating annual growth of about 4% to 6%. Water treatment, construction, energy, mining, and food processing remain major purchasing sectors. Industrial buyers increasingly need pumps that handle variable flow, abrasive fluids, and stricter efficiency targets.

Wastewater equipment should remain one of the strongest segments. Urban expansion is increasing demand for sewage, sludge, and desalination systems. Chemical processing also requires corrosion-resistant designs and accurate dosing. In agriculture, energy-efficient irrigation pumps are gaining attention as electricity costs remain difficult to predict. Digital monitoring is becoming practical, especially for large facilities with remote assets.

Forecasts are not clean.

Actual demand will differ by region. China, India, Southeast Asia, the Middle East, and parts of Africa may record stronger project activity than mature markets. However, delayed infrastructure funding could slow orders. Buyers should examine lifecycle cost, spare-part access, motor efficiency, and local service skills instead of comparing purchase prices alone.

In field evaluations, poor installation often causes more downtime than pump design. That is an uncomfortable detail. Manufacturers with verified testing, transparent performance curves, and documented maintenance support offer greater procurement reliability. Yet even reliable data can fail when operating conditions are guessed rather than measured.

How to Rank Top Pump Manufacturers by Capacity, Quality, and 20–30% Energy Savings

Ranking top pump manufacturers requires more than counting annual output. Measure verified capacity, operating range, test facilities, and after-sales response. A supplier producing millions of units may still lack experience with high-head, corrosive, or variable-flow systems. Request factory test curves, efficiency data, materials certificates, and references from similar installations. Field evidence matters more.

Quality should follow recognized methods. ISO 9906 defines hydraulic performance acceptance grades, while ISO 14414 supports pump-system energy assessments. Ask whether each model matches the real duty point, not merely the catalog maximum. Check vibration, seal performance, motor efficiency, and control compatibility. Small mismatches create large losses. I have seen oversized pumps throttle continuously, wasting energy at every shift.

Energy savings deserve careful verification. The U.S. Department of Energy’s Pumping System Sourcebook reports that optimized pumping systems can deliver substantial savings, often within a 20–50% opportunity range. A realistic 20–30% reduction may come from impeller trimming, variable-speed control, better piping, and corrected operating points. The International Energy Agency also identifies motor-driven systems as a major share of global electricity demand. Therefore, compare lifecycle cost, not purchase price. Require baseline measurements, calculated kWh reductions, and post-installation verification. Claims without operating data are weak. Even this method has limits: production changes can distort results, and savings may not repeat across sites.

2026 Top Pump Manufacturers for Global Buyers? - How to Rank Top Pump Manufacturers by Capacity, Quality, and 20–30% Energy Savings

Ranking Dimension Recommended Weight Verified Benchmark for a Top Manufacturer How Global Buyers Should Verify It Scoring Guide
Hydraulic Capacity
Flow rate and total head
20% Documented performance across the required operating range, including rated flow, rated head, shut-off head, and allowable operating limits. Request certified pump curves, duty-point calculations, tolerance data, and test reports based on ISO 9906 or an equivalent recognized standard. 5 = certified curve and test data closely match the duty point; 3 = partial data; 1 = unverified claims.
Product Range and Scalability
Standard and engineered pump systems
10% Ability to supply the required pump type, materials, motor options, control systems, and parallel or multi-stage configurations without compromising technical compliance. Compare the technical catalogue, materials list, customization limits, reference installations, and maximum tested operating conditions. 5 = complete configuration coverage; 3 = limited customization; 1 = major application gaps.
Efficiency and Lifecycle Energy Cost
Pump, motor, and system efficiency
20% High-efficiency hydraulic design, correctly selected impeller diameter, efficient motor, and variable-speed control where the system load varies. Check wire-to-water efficiency, motor efficiency class, input power at the actual duty point, affinity-law calculations, and annual energy-cost estimates. 5 = measured efficiency and lifecycle-cost evidence; 3 = calculated data only; 1 = no duty-point energy data.
20–30% Energy-Saving Potential
System optimization rather than pump label alone
10% A 20–30% reduction may be achievable in suitable variable-load systems through right-sizing, speed control, reduced throttling, hydraulic optimization, and removal of unnecessary bypass flow. Require a baseline-versus-proposed energy model using operating hours, flow profile, head losses, electricity price, and measured or validated input power. 5 = site-specific savings model with assumptions; 3 = generic estimate; 1 = unsupported guarantee. Savings are not universal.
Quality Management
Manufacturing consistency and traceability
15% Documented quality-management processes, controlled inspection plans, material traceability, calibrated test equipment, and corrective-action procedures. Review current ISO 9001 certification, inspection and test plans, nonconformance records, material certificates, and factory acceptance test procedures. 5 = independently audited and traceable; 3 = documented but limited evidence; 1 = informal quality controls.
Reliability and Service Life
Mechanical integrity and operating stability
10% Appropriate bearing, seal, shaft, casing, and wear-material selection; stable operation away from damaging recirculation, cavitation, and excessive vibration. Request vibration limits, NPSH margin calculations, bearing and seal specifications, failure-rate data, warranty terms, and comparable installation references. 5 = comprehensive reliability evidence; 3 = standard warranty only; 1 = no meaningful reliability documentation.
Compliance and Certification
Safety, efficiency, and market access
10% Applicable compliance with recognized requirements for electrical safety, motor efficiency, pressure equipment, hazardous areas, drinking water, or process industries. Verify certificates by model and production site; check validity, scope, testing laboratory, and whether the certificate applies to the offered configuration. 5 = complete project-specific compliance file; 3 = partial compliance; 1 = self-declared documentation only.
Delivery, Spare Parts, and Technical Support
Global project execution
10% Defined lead times, documented commissioning support, regional spare-parts availability, maintenance instructions, and responsive after-sales engineering. Confirm production capacity, delivery milestones, spare-parts list, service response time, training program, and escalation procedures in the contract. 5 = measurable service-level commitments; 3 = standard support; 1 = unclear delivery or service responsibility.
Recommended Total Score 100% Weighted score = Σ (criterion score ÷ 5 × criterion weight) Use the same duty point, operating profile, compliance requirements, and commercial assumptions for every shortlisted manufacturer. 90–100: preferred; 75–89: qualified; 60–74: conditional; <60: high procurement risk.
Important evaluation note: A 20–30% energy reduction is a project-level potential, not a universal pump-manufacturer specification. Actual savings depend on the existing pump, duty cycle, system curve, static head, throttling losses, control strategy, motor loading, maintenance condition, and electricity tariff.

Leading Pump Makers by Type: Centrifugal, Positive-Displacement, and Submersible

2026 Top Pump Manufacturers for Global Buyers

Choosing leading pump manufacturers requires more than comparing prices or catalog photos. The best supplier depends on pump type, operating conditions, and verified production capability. For centrifugal pumps, examine hydraulic efficiency, impeller balance, vibration control, and performance across changing flow rates. A reliable maker should provide factory test curves, material certificates, and clear maintenance intervals. Fit matters more.

Positive-displacement pumps suit applications needing stable flow, high pressure, or accurate dosing. Buyers should inspect diaphragm, screw, gear, or piston designs against fluid viscosity and temperature. During technical reviews, ask for seal-life data, pulsation controls, and spare-part availability in the destination region. A polished catalog can still hide weak testing. Request evidence from comparable installations.

Submersible pumps need special attention to insulation, cable sealing, motor cooling, and solids handling. Manufacturers with strong engineering teams explain how their pumps perform in flooded pits, sewage stations, or abrasive drainage environments. Look for ingress-protection documentation, motor temperature records, and practical lifting arrangements. Service response also matters when equipment sits several meters underwater. Keep evidence visible.

Global buyers should compare suppliers through witnessed testing, traceable quality records, and realistic lifecycle costs. A low purchase price may become expensive after repeated seal failures or difficult repairs. Regional voltage, language, shipping conditions, and local technical support deserve equal attention. Some specifications remain uncertain until field conditions change, so pilot testing can prevent confident mistakes.

Global Compliance Benchmarks: API 610, ISO 5199, NSF/ANSI 61, and Efficiency Rules

2026 Top Pump Manufacturers for Global Buyers?

Global buyers should compare compliance evidence before comparing price. API 610 sets demanding requirements for centrifugal pumps used in petroleum, petrochemical, and gas services. ISO 5199 supports technical requirements for centrifugal pump design, testing, and documentation. These standards do not replace project specifications. They create a practical baseline for reliability, vibration control, materials, and inspection.

Potable-water projects need a different checkpoint. NSF/ANSI 61 evaluates materials and components that contact drinking water. A pump may pass mechanical testing yet fail a water-contact requirement. Efficiency also deserves close attention. The U.S. Department of Energy reports that pump systems can represent 25% to 50% of industrial motor-system energy use in some facilities. The International Energy Agency estimates motor-driven systems consume more than 40% of global electricity. Small efficiency losses become expensive at continuous duty. Efficiency rules vary by market, and published ratings may not reflect actual operating points.

Tips: Request API 610 or ISO 5199 certificates, full performance curves, material traceability, and witnessed test records. Verify NSF/ANSI 61 scope for every wetted part. Ask for wire-to-water efficiency at your real flow and head. I have seen buyers accept a high headline efficiency, then discover poor performance after throttling. That is a useful warning. A factory audit, spare-parts plan, and clear warranty terms can reveal more than a polished brochure. Reports from the U.S. DOE Pumping Systems Assessment Tool and IEA motor-system analysis are useful references, but site measurements remain decisive.

2026 Buyer Comparison: Warranty, Lifecycle Cost, Delivery, and Regional Service Coverage

For global buyers, pump selection in 2026 is less about purchase price than verified operating support. A warranty should state coverage hours, seals, bearings, labor, transport, and response times. Ask for failure records from comparable duty cycles, not polished promises. In field reviews, unclear exclusions often create the largest repair bill. A two-year warranty may underperform a shorter one with local technicians and stocked parts. Keep that in the comparison file.

Lifecycle cost needs a practical model. Include energy consumption, scheduled maintenance, spare seals, downtime, installation, and disposal. Request pump curves at the actual flow, head, fluid temperature, and solids content. A small efficiency difference can become expensive after continuous operation. Yet calculations are often too neat. Real systems clog, operators change settings, and electricity prices move. Test assumptions against twelve months of site data when possible. If data is missing, mark the estimate as uncertain.

Delivery performance deserves the same scrutiny as engineering. Compare quoted lead time with recent shipment records, customs preparation, packaging quality, and replacement-part availability. Regional service coverage should include named technicians, training capacity, language support, and escalation routes. A distant service center may respond well on paper but slowly during a night shift. Require service-level commitments in writing. Visit one operating installation if the project allows. Photos cannot reveal vibration, access problems, or repeated seal failures. Good procurement still leaves room for revision.

2026 Global Pump Buyer Comparison

Non-brand industry benchmark comparing warranty, five-year lifecycle cost, delivery time, and regional service coverage.

Higher scores indicate a stronger purchasing position. The lifecycle-cost and delivery indicators are reverse-scored because lower costs and shorter lead times are preferable. Benchmark assumptions: 12–24 month warranty terms, 8–16 week standard delivery, five-year lifecycle cost index of 80–100, and 40%–85% regional service coverage. Confirm final terms through supplier quotations and service agreements.


Close

Raise your Query

Hi! Simply click below and type your query.

Our experts will reply you very soon.

WhatsApp Us